Set 1 : Assets
Q1-4. An old woman had the following assets:
(a) Rs. 70 lakh in bank deposits
(b) 1 house worth Rs. 50 lakh
(c) 3 flats, each worth Rs. 30 lakh
(d) Certain number of gold coins , each worth Rs. 1 lakh
She wanted to distribute her assets among her three children; Neeta, Seeta and Geeta. The house, any of the flats or any of the coins were not to be split. That is, the house went entirely to one child; a flat went to one child and similarly, a gold coin went to one child.
Among the three, Neeta received the least amount in bank deposits, while Geeta received the highest. The value of the assets was distributed equally among the children, as were the gold coins.
1. How much did Seeta receive in bank deposits (in lakhs of rupees)?
- 30
- 40
- 20
- 10
EXPLANATION
Answer: 20
Let us compute the total asset base = This is Rs. 70 lakhs + Rs. 50 lakhs + Rs. 3 * 30 lakhs + n (Where number of gold coins is n).
Or, 210 lakhs + n is what the total asset base. This is equally distributed, or n should be a multiple of 3. So, let us rewrite n as 3m. Let us say the total asset base is 210 + 3m. Each child should get 70 + m. The gold coins were also equally distributed. This tells us that each child got m gold coins each. This makes life simple. Now, the non-gold coin part should have been equally distributed. So, each child should have gotten Rs. 70 lakhs worth stuff. What can we infer from here?
So, each child should have gotten Rs. 70 lakhs worth stuff. 1. Whoever gets the house cannot get a flat. Or, the person who gets the house should get Rs. 20 lakhs in cash.
2. No one can get all three flats. So, the flats get distributed as 1 and 2 to the two remaining children. So, one child gets House + Rs. 20 lakhs, one gets one flat plus Rs. 40 lakhs, and the third received two flats and Rs. 10 lakhs.
3. Beyond all this they receive an equal number of gold coins.
No one can get all three flats. So, the flats get distributed as 1 and 2 to the two remaining children. So, one child gets House + Rs. 20 lakhs, one gets one flat plus Rs. 40 lakhs, and the third received two flats and Rs. 10 lakhs.
Neeta receives 2 flats and Rs. 10 lakhs, Geeta receives one flat and Rs. 40 lakhs and Seeta gets house and Rs. 20 lakhs.
From the stem, it is clear that Seeta receives a house and Rs. 20 lakhs in bank deposits.
Hence, the answer is “20 lakhs”.
Choice C is the correct answer.
2. How many flats did Neeta receive? (TITA)
EXPLANATION
Answer: 2 flats
Let us compute the total asset base = This is Rs. 70 lakhs + Rs. 50 lakhs + Rs. 3 * 30 lakhs + n (Where number of gold coins is n).
Or, 210 lakhs + n is what the total asset base. This is equally distributed, or n should be a multiple of 3. So, let us rewrite n as 3m. Let us say the total asset base is 210 + 3m. Each child should get 70 + m. The gold coins were also equally distributed. This tells us that each child got m gold coins each. This makes life simple. Now, the non-gold coin part should have been equally distributed. So, each child should have gotten Rs. 70 lakhs worth stuff. What can we infer from here?
So, each child should have gotten Rs. 70 lakhs worth stuff. 1. Whoever gets the house cannot get a flat. Or, the person who gets the house should get Rs. 20 lakhs in cash.
2. No one can get all three flats. So, the flats get distributed as 1 and 2 to the two remaining children. So, one child gets House + Rs. 20 lakhs, one gets one flat plus Rs. 40 lakhs, and the third received two flats and Rs. 10 lakhs.
3. Beyond all this they receive an equal number of gold coins.
No one can get all three flats. So, the flats get distributed as 1 and 2 to the two remaining children. So, one child gets House + Rs. 20 lakhs, one gets one flat plus Rs. 40 lakhs, and the third received two flats and Rs. 10 lakhs.
Neeta receives 2 flats and Rs. 10 lakhs, Geeta receives one flat and Rs. 40 lakhs and Seeta gets house and Rs. 20 lakhs.
Neeta got 2 flats.
Hence, the answer is “2 flats”.
3. The value of the assets distributed among Neeta, Seeta and Geeta was in the ratio of 1:2:3, while the gold coins were distributed among them in the ratio of 2:3:4. One child got all three flats and she did not get the house. One child, other than Geeta, got Rs. 30 lakh in bank deposits.
How many gold coins did the old woman have?
- 72
- 90
- 180
- 216
EXPLANATION
Answer: 90
Let us compute the total asset base = This is Rs. 70 lakhs + Rs. 50 lakhs + Rs. 3 * 30 lakhs + n (Where number of gold coins is n).
Or, 210 lakhs + n is what the total asset base. This is equally distributed, or n should be a multiple of 3. So, let us rewrite n as 3m. Let us say the total asset base is 210 + 3m. Each child should get 70 + m. The gold coins were also equally distributed. This tells us that each child got m gold coins each. This makes life simple. Now, the non-gold coin part should have been equally distributed. So, each child should have gotten Rs. 70 lakhs worth stuff. What can we infer from here?
So, each child should have gotten Rs. 70 lakhs worth stuff. 1. Whoever gets the house cannot get a flat. Or, the person who gets the house should get Rs. 20 lakhs in cash.
2. No one can get all three flats. So, the flats get distributed as 1 and 2 to the two remaining children. So, one child gets House + Rs. 20 lakhs, one gets one flat plus Rs. 40 lakhs, and the third received two flats and Rs. 10 lakhs.
3. Beyond all this they receive an equal number of gold coins.
No one can get all three flats. So, the flats get distributed as 1 and 2 to the two remaining children. So, one child gets House + Rs. 20 lakhs, one gets one flat plus Rs. 40 lakhs, and the third received two flats and Rs. 10 lakhs.
Neeta receives 2 flats and Rs. 10 lakhs, Geeta receives one flat and Rs. 40 lakhs and Seeta gets house and Rs. 20 lakhs.
The value of the assets were distributed in the ratio of 1:2:3. If we take them as 1x, 2x and 3x, then Total value = x + 2x + 3x = 6x.
If there are “m” gold coins, then the total 210 + m is a multiple of 6. 210 is a multiple of 6. So, m is a multiple of 6 => m = 6a.
Also, the gold coins were distributed in the ratio of 2:3:4 => No. of gold coins is 2y +3y + 4y = 9y. m = 9y .
m is a multiple of 6 and 9.Therefore, m is a multiple of 18. Hence, m can be expressed as 18k for some k. Now, total value of assets = 210 + 18k. This is split in the ratio of 1:2:3 among Neeta, Seeta and Geeta.
Neeta gets = 1/6 * (210 + 18K) = 35 + 3k = (35 – k ) + 4k.
Seeta gets = 2/6 * (210 + 18K) = 70 + 6k.
Geeta gets = 3/6 * (210 + 18K) = 105 + 9k = (105 + k ) + 8k.
We also know that, One child got all three flats and she did not get the house. One child, other than Geeta, got Rs. 30 lakh in bank deposits.
One of Seeta and Neeta got Rs. 30 lakh in bank deposits.
Seeta could not have got Rs. 30 lakh in bank deposits. Because, if she got Rs. 30 lakhs. Then the remaining amount she will have is 40 + 6k which is not possible through any combination.
Hence, Neeta gets Rs. 30 lakh in bank deposits.Neeta got totally (35 – k ) + 4k worth of assets. So, k = 5. Neeta gets Rs. 30 lakh in bank deposits and 4*5 = 20 gold coins.
Seeta gets one house and Rs. 20 lakh in bank deposits and 30 gold coins.
Geeta gets 3 flats and Rs. 20 lakh in bank deposits and 40 gold coins.
Therefore, total no. of gold coins = 20 + 30 + 40 = 90.
Hence, the answer is “90”.
Choice B is the correct answer.
4. The value of the assets distributed among Neeta, Seeta and Geeta was in the ratio of 1:2:3, while the gold coins were distributed among them in the ratio of 2:3:4. One child got all three flats and she did not get the house. One child, other than Geeta, got Rs. 30 lakh in bank deposits.
How much did Seeta get in bank deposits (in lakhs of rupees)? (TITA)
EXPLANATION
Answer: 20 lakh
Let us compute the total asset base = This is Rs. 70 lakhs + Rs. 50 lakhs + Rs. 3 * 30 lakhs + n (Where number of gold coins is n).
Or, 210 lakhs + n is what the total asset base. This is equally distributed, or n should be a multiple of 3. So, let us rewrite n as 3m. Let us say the total asset base is 210 + 3m. Each child should get 70 + m. The gold coins were also equally distributed. This tells us that each child got m gold coins each. This makes life simple. Now, the non-gold coin part should have been equally distributed. So, each child should have gotten Rs. 70 lakhs worth stuff. What can we infer from here?
So, each child should have gotten Rs. 70 lakhs worth stuff. 1. Whoever gets the house cannot get a flat. Or, the person who gets the house should get Rs. 20 lakhs in cash.
2. No one can get all three flats. So, the flats get distributed as 1 and 2 to the two remaining children. So, one child gets House + Rs. 20 lakhs, one gets one flat plus Rs. 40 lakhs, and the third received two flats and Rs. 10 lakhs.
3. Beyond all this they receive an equal number of gold coins.
No one can get all three flats. So, the flats get distributed as 1 and 2 to the two remaining children. So, one child gets House + Rs. 20 lakhs, one gets one flat plus Rs. 40 lakhs, and the third received two flats and Rs. 10 lakhs.
Neeta receives 2 flats and Rs. 10 lakhs, Geeta receives one flat and Rs. 40 lakhs and Seeta gets house and Rs. 20 lakhs.
Seeta got Rs. 20 lakh in bank deposits.
Hence, the answer is “20 lakhs”.
Set 2 : Chessboard
Q1-4. In an 8 X 8 chessboard a queen placed anywhere can attack another piece if the piece is present in the same row, or in the same column or in any diagonal position in any possible 4 directions, provided there is no other piece in between in the path from the queen to that piece. The columns are labelled a to h (left to right) and the rows are numbered 1 to 8 (bottom to top). The position of a piece is given by the combination of column and row labels. For example, position c5 means that the piece is in cth column and 5th row.
1. If the queen is at c5, and the other pieces at positions c2, gl, g3, g5 and a3, how many are under attack by the queen? There are no other pieces on the board.
- 2
- 3
- 4
- 5
EXPLANATION
Answer: 4
The columns are labelled a to h (left to right) and the rows are numbered 1 to 8 (bottom to top). The position of a piece is given by the combination of column and row labels.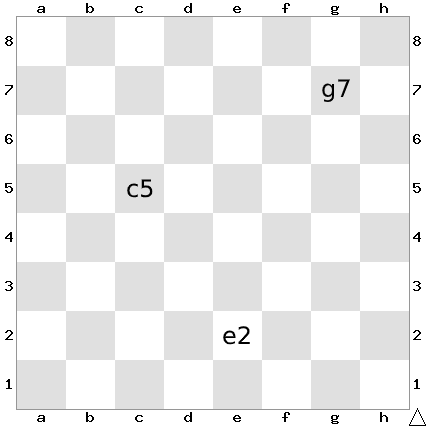
The total no. of ways is 4, as shown in the figure below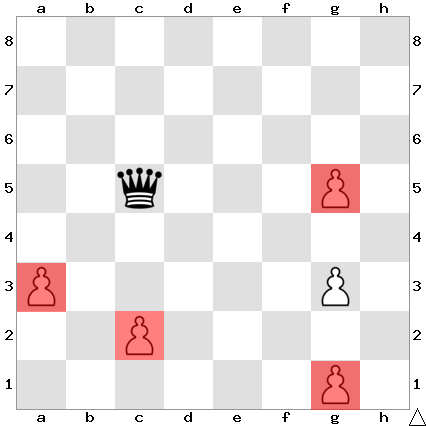
Hence, the answer is “4”.
Choice C is the correct answer.
2. If the other pieces are only at positions al, a3, b4, d7, h7 and h8, then which of the following positions of the queen results in the maximum number of pieces being under attack?
- f8
- a7
- c1
- d3
EXPLANATION
Answer: d3
The columns are labelled a to h (left to right) and the rows are numbered 1 to 8 (bottom to top). The position of a piece is given by the combination of column and row labels.
Queen in f8 – 2 positions under attack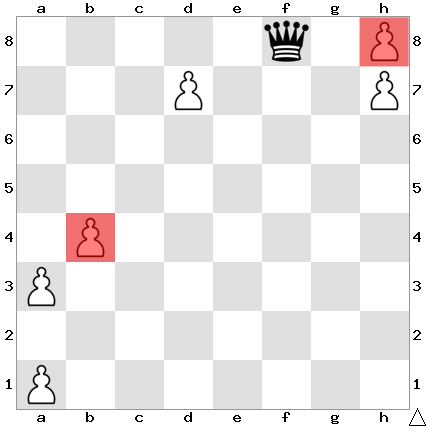
Queen in a8 – 2 positions under attack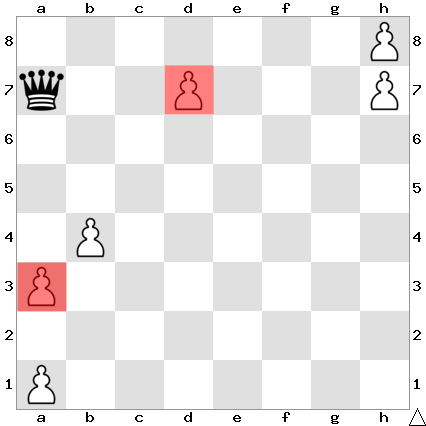
Queen in c1 – 2 positions under attack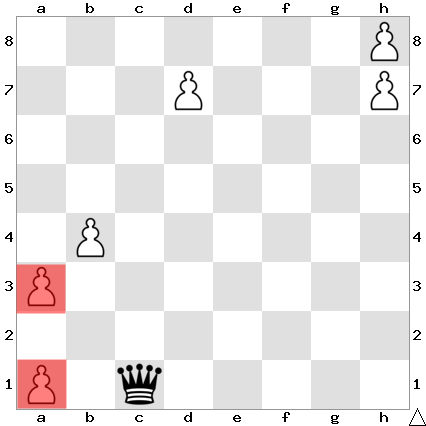
Queen in d3 – 3 positions under attack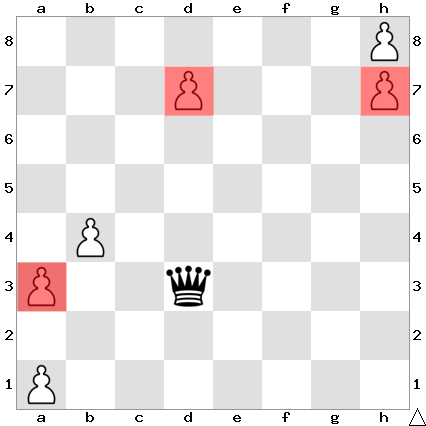
d3 is the correct answer.
Hence, the answer is “d3”.
Choice D is the correct answer.
3. If the other pieces are only at positions al, a3, b4, d7, h7 and h8, then from how many positions the queen cannot attack any of the pieces?
- 0
- 3
- 4
- 6
EXPLANATION
Answer: 4
The columns are labelled a to h (left to right) and the rows are numbered 1 to 8 (bottom to top). The position of a piece is given by the combination of column and row labels.
Let us think about the cells that will definitely get covered.
We eliminate 5 rows and 4 columns straight-away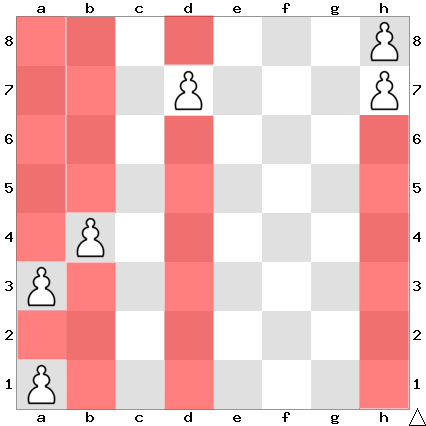
Now, let us go after the diagonals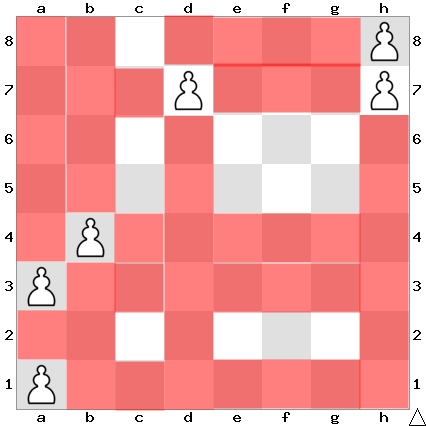
There are 4 cells remaining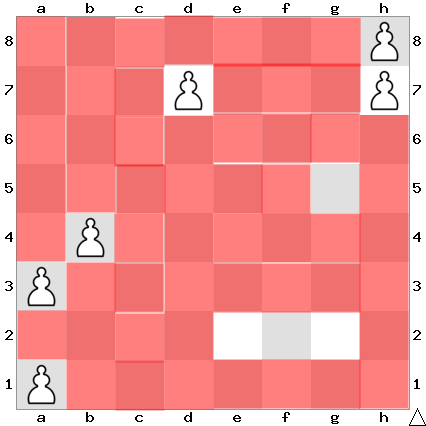
4 is the correct answer.
Hence, the answer is “4”.
Choice C is the correct answer.
4. Suppose the queen is the only piece on the board and it is at position d5. In how many positions can another piece be placed on the board such that it is safe from attack from the queen?
- 32
- 35
- 36
- 37
EXPLANATION
Answer: 36
The columns are labelled a to h (left to right) and the rows are numbered 1 to 8 (bottom to top). The position of a piece is given by the combination of column and row labels.
A row, a column and two diagonals are out.
Each of these has 8 squares.But there will be overlaps here.
Squares under attack = 8 + 7 + 7 + 6 = 28 (including the One the queen is on)
Squares not under attack = 36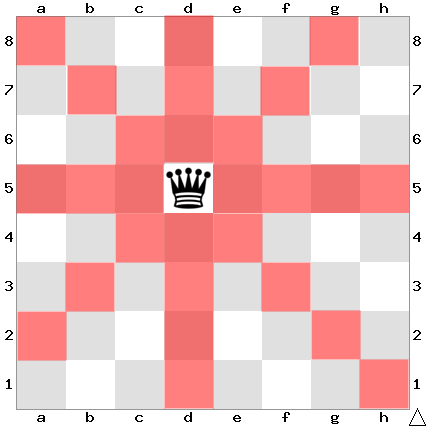
36 is the correct answer.
Hence, the answer is “36”.
Choice C is the correct answer.
Set 3 : Dorms
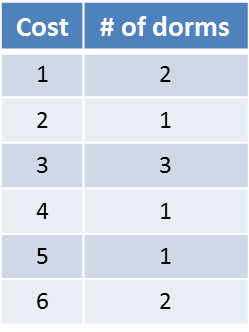
Q1-4. At a management school, the oldest 10 dorms, numbered 1 to 10, need to be repaired urgently, The diagram represents the estimated repair costs (in Rs. Crores) for the 10 dorms. For any dorm, the estimated repair cost (in Rs. Crores) is an integer. Repairs with estimated cost Rs. 1 or 2 Crores are considered light repairs, repairs with estimated cost Rs. 3 or 4 are considered moderate repairs and repairs with estimated cost Rs. 5 or 6 Crores are considered extensive repairs.
Further, the following are known:
1. Odd-numbered dorms do not need light repair; even-numbered dorms do not need moderate repair and dorms, whose numbers are divisible by 3, do not need extensive repair.
2. Dorms 4 to 9 all need different repair costs, with Dorm 7 needing the maximum and Dorm 8 needing the minimum.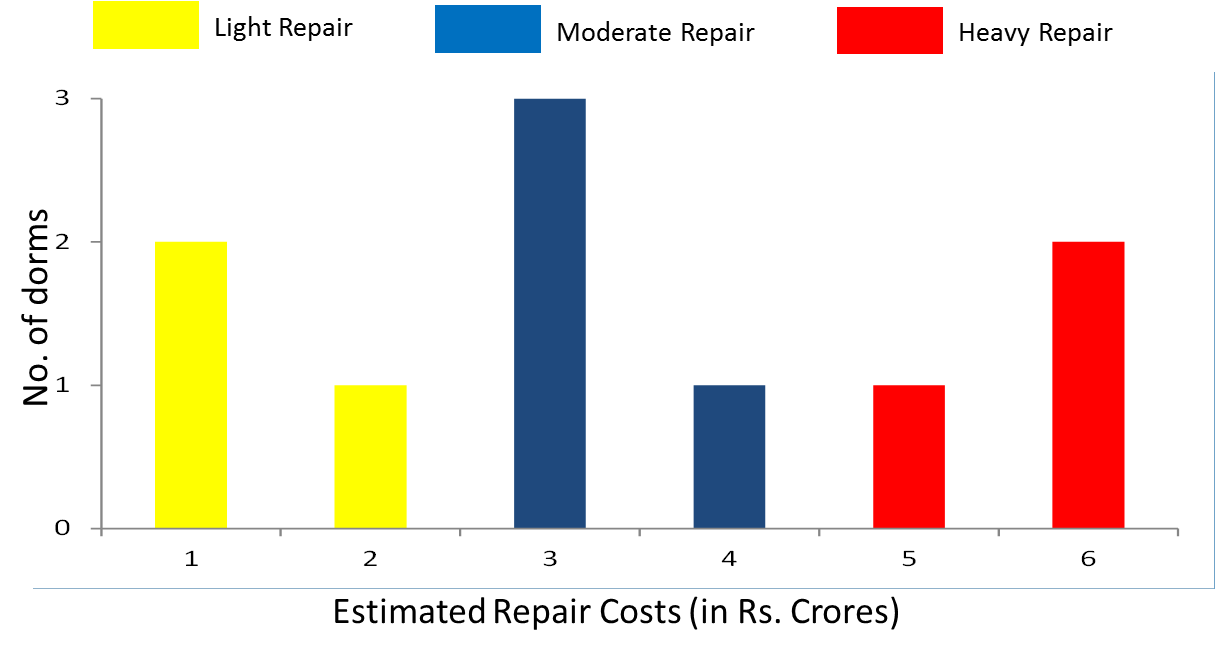
1. Which of the following is NOT necessarily true?
- Dorm 1 needs a moderate repair
- Dorm 5 repair will cost no more than Rs. 4 Crores
- Dorm 7 needs an extensive repair
- Dorm 10 repair will cost no more than Rs. 4 Crores
EXPLANATION
Answer: 4 crores
Let us go step-by-step. We have 10 dorms, each with some repairs needing to be done. Repair costs would be Rs. 1 crore, Rs. 2 crores, Rs. 3 crores, 4, 5 or 6 crores.
From the irritating and unnecessary chart, we can infer that 2 dorms have repair costs of Rs. 1 crore each, 1 has a cost of Rs. 2c, 3 cost Rs. 3C, one each costs Rs. 4C and Rs, 5 C, and finally two dorms take up Rs. 6 crores each. Total cost should be Rs. 34 crores.
Now, let us try to do this more visually. Even-numbered ones do not need moderate repairs – or all 4 moderate-repair dorms are odd-numbered. Likewise, all 3 light-repair ones are even-numbered.
So, odd numbered dorms – 4 moderate and one extensive
Even-numbered dorms – 3 light-repair ones and two extensive.
Dorms 4 to 9 should have all costs from Rs. 1 crore to Rs. 6 crores. Dorm 7 should see Rs. 6 crores and dorm 8 should see Rs. 1 crore.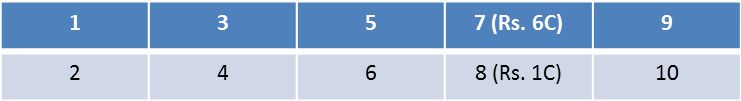
Dorms 1, 3, 5, 9 should all have moderate numbers. So, three of them should cost RS. 3C and one should cost Rs. 4C. Dorms 4, 5, 6 and 9 should have costs 2, 3, 4, 5.
Put these two together!
Dorms 5 and 9 – Rs. 3C and Rs. 4C
Dorms 4 and 6 – Rs. 2C and Rs. 5C. Dorms that are multiples of 3 do not need extensive repair.
What does this tell us?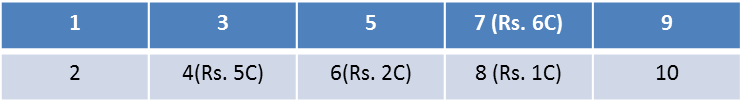
So, dorm 6 should cost Rs. 2C and dorm 4 should cost Rs. 5C.
What can we say about dorms 1 and 3?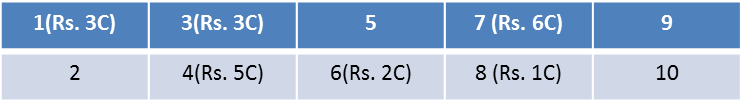
Both 1 and 3 should have seen moderate costs and since one of 5 or 9 costs Rs. 4C.
Both 1 and 3 should cost Rs. 3C.
What else do we have?
Dorms 5 and 9 – Costs Rs. 3C and Rs. 4C in some order
Dorms 2 and 10 – Costs Rs. 1C and Rs. 6C in some order.
Now, let us go to the questions
Statement A has to be true. Statement B also has to be true as dorm 5 will see a cost of Rs. 3C or Rs. 4C. Statement 7 has to bne true as it sees a cost of Rs. 6C. Statement D need not be true. Dorm 10 could see a cost of Rs. 1C or Rs. 6C.
Hence, the answer is “Dorm 10 repair will cost no more than Rs. 4 Crores”.
Choice D is the correct answer.
2. What is the total cost of repairing the odd-numbered dorms (in Rs. Crores)? (TITA)
EXPLANATION
Answer: 19 crores
Let us go step-by-step. We have 10 dorms, each with some repairs needing to be done. Repair costs would be Rs. 1 crore, Rs. 2 crores, Rs. 3 crores, 4, 5 or 6 crores.
From the irritating and unnecessary chart, we can infer that 2 dorms have repair costs of Rs. 1 crore each, 1 has a cost of Rs. 2c, 3 cost Rs. 3C, one each costs Rs. 4C and Rs, 5 C, and finally two dorms take up Rs. 6 crores each. Total cost should be Rs. 34 crores.
Now, let us try to do this more visually. Even-numbered ones do not need moderate repairs – or all 4 moderate-repair dorms are odd-numbered. Likewise, all 3 light-repair ones are even-numbered.
So, odd numbered dorms – 4 moderate and one extensive
Even-numbered dorms – 3 light-repair ones and two extensive.
Dorms 4 to 9 should have all costs from Rs. 1 crore to Rs. 6 crores. Dorm 7 should see Rs. 6 crores and dorm 8 should see Rs. 1 crore.
Dorms 1, 3, 5, 9 should all have moderate numbers. So, three of them should cost RS. 3C and one should cost Rs. 4C. Dorms 4, 5, 6 and 9 should have costs 2, 3, 4, 5.
Put these two together!
Dorms 5 and 9 – Rs. 3C and Rs. 4C
Dorms 4 and 6 – Rs. 2C and Rs. 5C. Dorms that are multiples of 3 do not need extensive repair.
What does this tell us?
So, dorm 6 should cost Rs. 2C and dorm 4 should cost Rs. 5C.
What can we say about dorms 1 and 3?
Both 1 and 3 should have seen moderate costs and since one of 5 or 9 costs Rs. 4C.
Both 1 and 3 should cost Rs. 3C.
What else do we have?
Dorms 5 and 9 – Costs Rs. 3C and Rs. 4C in some order
Dorms 2 and 10 – Costs Rs. 1C and Rs. 6C in some order.
Now, let us go to the questions
Total cost of repairing odd-numbered dorms is 3 + 3 + 6 + 3 + 4 = Rs. 19 crores.
Hence, the answer is “Rs. 19 crores.”.
3. Suppose further that:
a. 4 of the 10 dorms needing repair are women’s dorms and need a total of Rs. 20 Crores for repair.
b. Only one of Dorms 1 to 5 is a women’s dorm.
What is the cost for repairing Dorm 9 (in Rs. Crores)? (TITA)
EXPLANATION
Answer: 3 crores
Let us go step-by-step. We have 10 dorms, each with some repairs needing to be done. Repair costs would be Rs. 1 crore, Rs. 2 crores, Rs. 3 crores, 4, 5 or 6 crores.
From the irritating and unnecessary chart, we can infer that 2 dorms have repair costs of Rs. 1 crore each, 1 has a cost of Rs. 2c, 3 cost Rs. 3C, one each costs Rs. 4C and Rs, 5 C, and finally two dorms take up Rs. 6 crores each. Total cost should be Rs. 34 crores.
Now, let us try to do this more visually. Even-numbered ones do not need moderate repairs – or all 4 moderate-repair dorms are odd-numbered. Likewise, all 3 light-repair ones are even-numbered.
So, odd numbered dorms – 4 moderate and one extensive
Even-numbered dorms – 3 light-repair ones and two extensive.
Dorms 4 to 9 should have all costs from Rs. 1 crore to Rs. 6 crores. Dorm 7 should see Rs. 6 crores and dorm 8 should see Rs. 1 crore.
Dorms 1, 3, 5, 9 should all have moderate numbers. So, three of them should cost RS. 3C and one should cost Rs. 4C. Dorms 4, 5, 6 and 9 should have costs 2, 3, 4, 5.
Put these two together!
Dorms 5 and 9 – Rs. 3C and Rs. 4C
Dorms 4 and 6 – Rs. 2C and Rs. 5C. Dorms that are multiples of 3 do not need extensive repair.
What does this tell us?
So, dorm 6 should cost Rs. 2C and dorm 4 should cost Rs. 5C.
What can we say about dorms 1 and 3?
Both 1 and 3 should have seen moderate costs and since one of 5 or 9 costs Rs. 4C.
Both 1 and 3 should cost Rs. 3C.
What else do we have?
Dorms 5 and 9 – Costs Rs. 3C and Rs. 4C in some order
Dorms 2 and 10 – Costs Rs. 1C and Rs. 6C in some order.
Now, let us go to the questions
4 dorms should add up to Rs. 20 crores. Now, Rs. 20 crores is a large number.
So, let us see if we can eliminate some possibilities from that.
The top 3 costs are Rs. 6, 6 and 5.
These 3 add up to Rs. 17. So, no women’s dorm can cost less than Rs. 3C.
Now, only one of dorms from 1 to 5 is a women’s dorm. So, three out of 6 to 10 should be women’s dorms. What does this tell us?
Dorms 6 and 8 see costs of Rs. 2C and 1C – these cannot be women’s dorms.
So, 7, 9 and 10 should be women’s dorms. So, dorm 10 should cost Rs. 6C (as it cannot be Rs.1C)
So, 7, 9 and 10 should be women’s dorms. Dorms 7 and 10 add up to a cost of Rs. 12 Crores.
Dorm 9 and one other should add up to Rs. 8 crores. How much does dorm 9 cost?
If dorm 9 were to cost Rs. 4C, then the one of dorms 1 to 5 should also cost Rs. 4C – this is impossible.
So, dorm 9 should cost Rs. 3C. The Women’s dorms should be 7, 9, 10 and 4.
Cost of repairing dorm 9 would be Rs. 3C.
Hence, the answer is “Rs. 3 crores.”.
4. Suppose further that:
1. 4 of the 10 dorms needing repair are women’s dorms and need a total of Rs. 20 Crores for repair.
2. Only one of Dorms 1 to 5 is a women’s dorm.
Which of the following is a women’s dorm?
- Dorm 2
- Dorm 5
- Dorm 8
- Dorm 10
EXPLANATION
Answer: Dorm 10
Let us go step-by-step. We have 10 dorms, each with some repairs needing to be done. Repair costs would be Rs. 1 crore, Rs. 2 crores, Rs. 3 crores, 4, 5 or 6 crores.
From the irritating and unnecessary chart, we can infer that 2 dorms have repair costs of Rs. 1 crore each, 1 has a cost of Rs. 2c, 3 cost Rs. 3C, one each costs Rs. 4C and Rs, 5 C, and finally two dorms take up Rs. 6 crores each. Total cost should be Rs. 34 crores.
Now, let us try to do this more visually. Even-numbered ones do not need moderate repairs – or all 4 moderate-repair dorms are odd-numbered. Likewise, all 3 light-repair ones are even-numbered.
So, odd numbered dorms – 4 moderate and one extensive
Even-numbered dorms – 3 light-repair ones and two extensive.
Dorms 4 to 9 should have all costs from Rs. 1 crore to Rs. 6 crores. Dorm 7 should see Rs. 6 crores and dorm 8 should see Rs. 1 crore.
Dorms 1, 3, 5, 9 should all have moderate numbers. So, three of them should cost RS. 3C and one should cost Rs. 4C. Dorms 4, 5, 6 and 9 should have costs 2, 3, 4, 5.
Put these two together!
Dorms 5 and 9 – Rs. 3C and Rs. 4C
Dorms 4 and 6 – Rs. 2C and Rs. 5C. Dorms that are multiples of 3 do not need extensive repair.
What does this tell us?
So, dorm 6 should cost Rs. 2C and dorm 4 should cost Rs. 5C.
What can we say about dorms 1 and 3?
Both 1 and 3 should have seen moderate costs and since one of 5 or 9 costs Rs. 4C.
Both 1 and 3 should cost Rs. 3C.
What else do we have?
Dorms 5 and 9 – Costs Rs. 3C and Rs. 4C in some order
Dorms 2 and 10 – Costs Rs. 1C and Rs. 6C in some order.
Now, let us go to the questions
If dorm 9 were to cost Rs. 4C, then the one of dorms 1 to 5 should also cost Rs. 4C – this is impossible. So, dorm 9 should cost Rs. 3C. The Women’s dorms should be 7, 9, 10 and 4.
Hence, the answer is “Dorm 10”.
Choice D is the correct answer.
Set 4 : Eight Friends
Q1-4. Eight friends: Ajit, Byomkesh, Gargi, Jayanta, Kikira, Manik, Prodosh and Tapesh are going to Delhi from Kolkata by a flight operated by Cheap Air. In the flight, sitting is arranged in 30 rows, numbered 1 to 30, each consisting of 6 seats, marked by letters A to F from left to right, respectively. Seats A to C are to the left of the aisle (the passage running from the front of the aircraft to the back), and seats D to F are to the right of the aisle. Seats A and F are by the windows and referred to as Window seats, C and D are by the aisle and are referred to as Aisle seats while B and E are referred to as Middle seats. Seats marked by consecutive letters are called consecutive seats (or seats next to each other). A seat number is a combination of the row number, followed by the letter indicating the position in the row; e.g., 1A is the left window seat in the first row, while 12E is the right middle seat in the 12th row.
Cheap Air charges Rs. 1000 extra for any seats in Rows 1, 12 and 13 as those have extra legroom. For Rows 2-10, it charges Rs. 300 extra for Window seats and Rs. 500 extra for Aisle seats. For Rows 11 and 14 to 20, it charges Rs. 200 extra for Window seats and Rs. 400 extra for Aisle seats. All other seats are available at no extra charge.
The following are known:
1. The eight friends were seated in six different rows.
2. They occupied 3 Window seats, 4 Aisle seats and 1 Middle seat.
3. Seven of them had to pay extra amounts, totaling to Rs. 4600, for their choices of seat. One of them did not pay any additional amount for his/her choice of seat.
4. Jayanta, Ajit and Byomkesh were sitting in seats marked by the same letter, in consecutive rows in increasing order of row numbers; but all of them paid different amounts for their choices of seat. One of these amounts may be zero.
5. Gargi was sitting next to Kikira, and Manik was sitting next to Jayanta.
6. Prodosh and Tapesh were sitting in seats marked by the same letter, in consecutive rows in increasing order of row numbers; but they paid different amounts for their choices of seat. One of these amounts may be zero.
1. In which row was Manik sitting?
- 10
- 11
- 12
- 13
EXPLANATION
Answer: 10
Let us draw a simple diagram and visualize this.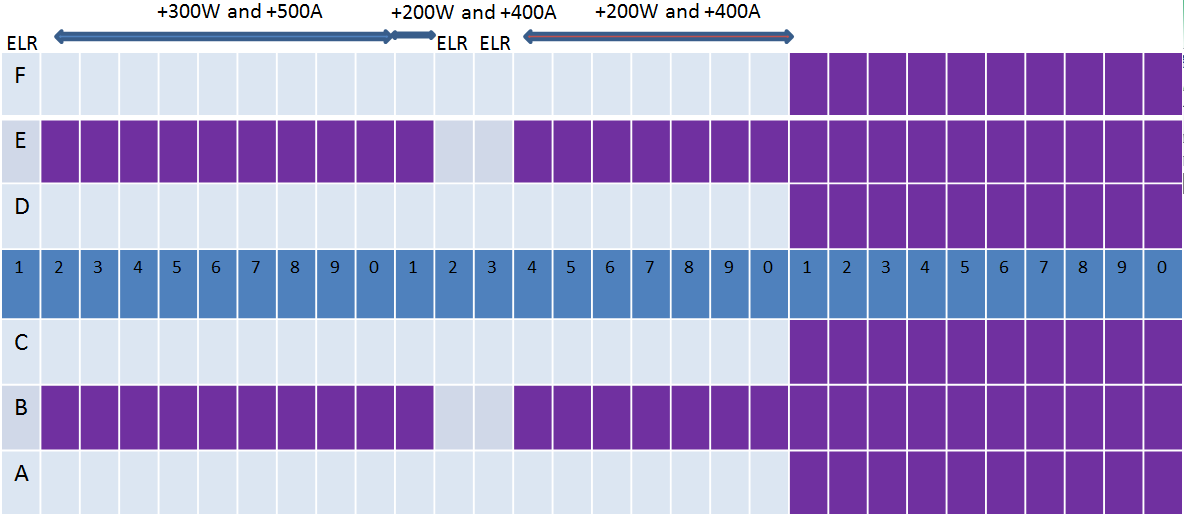
4. Jayanta, Ajit and Byomkesh were sitting in seats marked by the same letter, in consecutive rows in increasing order of row numbers; but all of them paid different amounts for their choices of seat. One of these amounts may be zero.
Where should these three be? J, A and B should be in rows 10, 11 and 12 and should be window or aisle seats.
J = Row 10, A = Row 11, B = Row 12. All three aisle or all three window.
6. Prodosh and Tapesh were sitting in seats marked by the same letter, in consecutive rows in increasing order of row numbers; but they paid different amounts for their choices of seat. One of these amounts may be zero.
Where should these two be? They could be in rows 1 and 2, 13 & 14, or 20 & 21. They should be aisle seats if JAB take window . Window seats in JAB take aisle seats.
5. Gargi was sitting next to Kikira, and Manik was sitting next to Jayanta.
If seats are adjacent to each other, either they should both be aisle seats or we should have a middle seat involved.
So, JAB were aisle seats, then Manik also has to be an aisle seat, and GK have to be window and middle seat. In which case P&T would have window seats
If JAB have window seats, M would have to have a middle seat. GK would have to be two aisle seats and PT would have to take two aisle seats.
Possibility 1 = JABM Aisle in row number 10, 11, 12 and 10
GK = window and middle seats, PT = two window seats.
Possibility 2 = JABM seated in 3 window seats and a middle seat row number 10, 11, 12 and 10
GK = aisle seats, PT = two aisle seats.
3. Seven of them had to pay extra amounts, totaling to Rs. 4600, for their choices of seat. One of them did not pay any additional amount for his/her choice of seat.
4600 across 7 members. This is a lot of extra money. There has to be at least one Rs. 1000 extra. This leaves 3600 across 6 members. An average of Rs. 600 extra per person. This is also high. This tells us that there should have been two folks paying Rs. 1000 extra.So, we have Rs. 1000, Rs. 1000 and Rs. 2600 distributed across 5 people. This also averages out to more than Rs. 500. This tells us that we should have had 3 people paying Rs. 1000 extra. So, we have Rs. 1000, Rs. 1000, Rs, 1000 and Rs. 1600 across 4 people.So, we could have someone sitting in rows 1, 12 and 13. We also have folks in 10 and 11.
5. Gargi was sitting next to Kikira, and Manik was sitting next to Jayanta.
Possibility 1 = JABM Aisle in row number 10, 11, 12 and 10
GK = window and middle seats, PT = two window seats.
Extra charge for JABM = 500+400+1000+500 = 2400
3out of the other 4 should give 2200 – this should be 1000 + 1000 + 200. Or, GK could be Rs. 1000 seats in, row 13 or row 1. and PT could have window seats in rows 20 and 21.
Possibility 2 = JABM seated in 3 window seats and a middle seat row number 10, 11, 12 and 10
GK = aisle seats, PT = two aisle seats.
Extra charge for JABM = 300+200+1000+0 = 1500
The other 4 should add up to 3100. This should be as 1000 + 1000 + remaining. The remaining two cannot add up to 1100. So, this possibility can be eliminated.
Final State
JABM Aisle in row number 10, 11, 12 and 10
GK = window and middle seats in row 1 or row 13
PT = two window seats in rows 20 and 21.
Extra charge for JABM = 500+400+1000+500 = 2400
Extra charge for G and K = 1000 + 1000 = 2000
Extra charge for P and T = Rs. 200 + 0.
Manik sat in Aisle of row 10
Hence, the answer is “10”.
Choice A is the correct answer.
2. How much extra did Jayanta pay for his choice of seat?
- Rs.300
- Rs.400
- Rs.500
- Rs.1000
EXPLANATION
Answer: Rs. 500
Let us draw a simple diagram and visualize this.
4. Jayanta, Ajit and Byomkesh were sitting in seats marked by the same letter, in consecutive rows in increasing order of row numbers; but all of them paid different amounts for their choices of seat. One of these amounts may be zero.
Where should these three be? J, A and B should be in rows 10, 11 and 12 and should be window or aisle seats.
J = Row 10, A = Row 11, B = Row 12. All three aisle or all three window.
6. Prodosh and Tapesh were sitting in seats marked by the same letter, in consecutive rows in increasing order of row numbers; but they paid different amounts for their choices of seat. One of these amounts may be zero.
Where should these two be? They could be in rows 1 and 2, 13 & 14, or 20 & 21. They should be aisle seats if JAB take window . Window seats in JAB take aisle seats.
5. Gargi was sitting next to Kikira, and Manik was sitting next to Jayanta.
If seats are adjacent to each other, either they should both be aisle seats or we should have a middle seat involved.
So, JAB were aisle seats, then Manik also has to be an aisle seat, and GK have to be window and middle seat. In which case P&T would have window seats
If JAB have window seats, M would have to have a middle seat. GK would have to be two aisle seats and PT would have to take two aisle seats.
Possibility 1 = JABM Aisle in row number 10, 11, 12 and 10
GK = window and middle seats, PT = two window seats.
Possibility 2 = JABM seated in 3 window seats and a middle seat row number 10, 11, 12 and 10
GK = aisle seats, PT = two aisle seats.
3. Seven of them had to pay extra amounts, totaling to Rs. 4600, for their choices of seat. One of them did not pay any additional amount for his/her choice of seat.
4600 across 7 members. This is a lot of extra money. There has to be at least one Rs. 1000 extra. This leaves 3600 across 6 members. An average of Rs. 600 extra per person. This is also high. This tells us that there should have been two folks paying Rs. 1000 extra.So, we have Rs. 1000, Rs. 1000 and Rs. 2600 distributed across 5 people. This also averages out to more than Rs. 500. This tells us that we should have had 3 people paying Rs. 1000 extra. So, we have Rs. 1000, Rs. 1000, Rs, 1000 and Rs. 1600 across 4 people.So, we could have someone sitting in rows 1, 12 and 13. We also have folks in 10 and 11.
5. Gargi was sitting next to Kikira, and Manik was sitting next to Jayanta.
Possibility 1 = JABM Aisle in row number 10, 11, 12 and 10
GK = window and middle seats, PT = two window seats.
Extra charge for JABM = 500+400+1000+500 = 2400
3out of the other 4 should give 2200 – this should be 1000 + 1000 + 200. Or, GK could be Rs. 1000 seats in, row 13 or row 1. and PT could have window seats in rows 20 and 21.
Possibility 2 = JABM seated in 3 window seats and a middle seat row number 10, 11, 12 and 10
GK = aisle seats, PT = two aisle seats.
Extra charge for JABM = 300+200+1000+0 = 1500
The other 4 should add up to 3100. This should be as 1000 + 1000 + remaining. The remaining two cannot add up to 1100. So, this possibility can be eliminated.
Final State
JABM Aisle in row number 10, 11, 12 and 10
GK = window and middle seats in row 1 or row 13
PT = two window seats in rows 20 and 21.
Extra charge for JABM = 500+400+1000+500 = 2400
Extra charge for G and K = 1000 + 1000 = 2000
Extra charge for P and T = Rs. 200 + 0.
Jayant sat in Aisle of row 10. So, he should have paid an extra Rs. 500.
Hence, the answer is “Rs.500”.
Choice C is the correct answer.
3. How much extra did Gargi pay for her choice of seat?
- Rs.0
- Rs.300
- Rs.500
- Rs.1000
EXPLANATION
Answer: Rs. 1,000
Let us draw a simple diagram and visualize this.
4. Jayanta, Ajit and Byomkesh were sitting in seats marked by the same letter, in consecutive rows in increasing order of row numbers; but all of them paid different amounts for their choices of seat. One of these amounts may be zero.
Where should these three be? J, A and B should be in rows 10, 11 and 12 and should be window or aisle seats.
J = Row 10, A = Row 11, B = Row 12. All three aisle or all three window.
6. Prodosh and Tapesh were sitting in seats marked by the same letter, in consecutive rows in increasing order of row numbers; but they paid different amounts for their choices of seat. One of these amounts may be zero.
Where should these two be? They could be in rows 1 and 2, 13 & 14, or 20 & 21. They should be aisle seats if JAB take window . Window seats in JAB take aisle seats.
5. Gargi was sitting next to Kikira, and Manik was sitting next to Jayanta.
If seats are adjacent to each other, either they should both be aisle seats or we should have a middle seat involved.
So, JAB were aisle seats, then Manik also has to be an aisle seat, and GK have to be window and middle seat. In which case P&T would have window seats
If JAB have window seats, M would have to have a middle seat. GK would have to be two aisle seats and PT would have to take two aisle seats.
Possibility 1 = JABM Aisle in row number 10, 11, 12 and 10
GK = window and middle seats, PT = two window seats.
Possibility 2 = JABM seated in 3 window seats and a middle seat row number 10, 11, 12 and 10
GK = aisle seats, PT = two aisle seats.
3. Seven of them had to pay extra amounts, totaling to Rs. 4600, for their choices of seat. One of them did not pay any additional amount for his/her choice of seat.
4600 across 7 members. This is a lot of extra money. There has to be at least one Rs. 1000 extra. This leaves 3600 across 6 members. An average of Rs. 600 extra per person. This is also high. This tells us that there should have been two folks paying Rs. 1000 extra.So, we have Rs. 1000, Rs. 1000 and Rs. 2600 distributed across 5 people. This also averages out to more than Rs. 500. This tells us that we should have had 3 people paying Rs. 1000 extra. So, we have Rs. 1000, Rs. 1000, Rs, 1000 and Rs. 1600 across 4 people.So, we could have someone sitting in rows 1, 12 and 13. We also have folks in 10 and 11.
5. Gargi was sitting next to Kikira, and Manik was sitting next to Jayanta.
Possibility 1 = JABM Aisle in row number 10, 11, 12 and 10
GK = window and middle seats, PT = two window seats.
Extra charge for JABM = 500+400+1000+500 = 2400
3out of the other 4 should give 2200 – this should be 1000 + 1000 + 200. Or, GK could be Rs. 1000 seats in, row 13 or row 1. and PT could have window seats in rows 20 and 21.
Possibility 2 = JABM seated in 3 window seats and a middle seat row number 10, 11, 12 and 10
GK = aisle seats, PT = two aisle seats.
Extra charge for JABM = 300+200+1000+0 = 1500
The other 4 should add up to 3100. This should be as 1000 + 1000 + remaining. The remaining two cannot add up to 1100. So, this possibility can be eliminated.
Final State
JABM Aisle in row number 10, 11, 12 and 10
GK = window and middle seats in row 1 or row 13
PT = two window seats in rows 20 and 21.
Extra charge for JABM = 500+400+1000+500 = 2400
Extra charge for G and K = 1000 + 1000 = 2000
Extra charge for P and T = Rs. 200 + 0.
G and K sat in window and aisle seats of row 1 or 13. So, an additional amount of Rs. 1000 was paid.
Hence, the answer is “Rs.1000”.
Choice D is the correct answer.
4. Who among the following did not pay any extra amount for his/her choice of seat?
- Kikira
- Manik
- Gargi
- Tapesh
EXPLANATION
Answer: Tapesh
Let us draw a simple diagram and visualize this.
4. Jayanta, Ajit and Byomkesh were sitting in seats marked by the same letter, in consecutive rows in increasing order of row numbers; but all of them paid different amounts for their choices of seat. One of these amounts may be zero.
Where should these three be? J, A and B should be in rows 10, 11 and 12 and should be window or aisle seats.
J = Row 10, A = Row 11, B = Row 12. All three aisle or all three window.
6. Prodosh and Tapesh were sitting in seats marked by the same letter, in consecutive rows in increasing order of row numbers; but they paid different amounts for their choices of seat. One of these amounts may be zero.
Where should these two be? They could be in rows 1 and 2, 13 & 14, or 20 & 21. They should be aisle seats if JAB take window . Window seats in JAB take aisle seats.
5. Gargi was sitting next to Kikira, and Manik was sitting next to Jayanta.
If seats are adjacent to each other, either they should both be aisle seats or we should have a middle seat involved.
So, JAB were aisle seats, then Manik also has to be an aisle seat, and GK have to be window and middle seat. In which case P&T would have window seats
If JAB have window seats, M would have to have a middle seat. GK would have to be two aisle seats and PT would have to take two aisle seats.
Possibility 1 = JABM Aisle in row number 10, 11, 12 and 10
GK = window and middle seats, PT = two window seats.
Possibility 2 = JABM seated in 3 window seats and a middle seat row number 10, 11, 12 and 10
GK = aisle seats, PT = two aisle seats.
3. Seven of them had to pay extra amounts, totaling to Rs. 4600, for their choices of seat. One of them did not pay any additional amount for his/her choice of seat.
4600 across 7 members. This is a lot of extra money. There has to be at least one Rs. 1000 extra. This leaves 3600 across 6 members. An average of Rs. 600 extra per person. This is also high. This tells us that there should have been two folks paying Rs. 1000 extra.So, we have Rs. 1000, Rs. 1000 and Rs. 2600 distributed across 5 people. This also averages out to more than Rs. 500. This tells us that we should have had 3 people paying Rs. 1000 extra. So, we have Rs. 1000, Rs. 1000, Rs, 1000 and Rs. 1600 across 4 people.So, we could have someone sitting in rows 1, 12 and 13. We also have folks in 10 and 11.
5. Gargi was sitting next to Kikira, and Manik was sitting next to Jayanta.
Possibility 1 = JABM Aisle in row number 10, 11, 12 and 10
GK = window and middle seats, PT = two window seats.
Extra charge for JABM = 500+400+1000+500 = 2400
3out of the other 4 should give 2200 – this should be 1000 + 1000 + 200. Or, GK could be Rs. 1000 seats in, row 13 or row 1. and PT could have window seats in rows 20 and 21.
Possibility 2 = JABM seated in 3 window seats and a middle seat row number 10, 11, 12 and 10
GK = aisle seats, PT = two aisle seats.
Extra charge for JABM = 300+200+1000+0 = 1500
The other 4 should add up to 3100. This should be as 1000 + 1000 + remaining. The remaining two cannot add up to 1100. So, this possibility can be eliminated.
Final State
JABM Aisle in row number 10, 11, 12 and 10
GK = window and middle seats in row 1 or row 13
PT = two window seats in rows 20 and 21.
Extra charge for JABM = 500+400+1000+500 = 2400
Extra charge for G and K = 1000 + 1000 = 2000
Extra charge for P and T = Rs. 200 + 0.
G and K sat in window and aisle seats of row 1 or 13. So, an additional amount of Rs. 1000 was paid.
Hence, the answer is “Tapesh”.
Choice D is the correct answer.
Set 5 : Electives
Q1-4. There were seven elective courses – E1 to E7 – running in a specific term in a college. Each of the 300 students enrolled had chosen just one elective from among these seven. However, before the start of the term, E7 was withdrawn as the instructor concerned had left the college. The students who had opted for E7 were allowed to join any of the remaining electives. Also, the students who had chosen other electives were given one chance to change their choice. The table below captures the movement of the students from one elective to another during this process. Movement from one elective to the same elective simply means no movement. Some numbers in the table got accidentally erased; however, it is known that these were either 0 or 1.
Further, the following are known:
1. Before the change process there were 6 more students in E1 than in E4, but after the reshuffle, the number of students in E4 was 3 more than that in E1.
2. The number of students in E2 increased by 30 after the change process.
3. Before the change process, E4 had 2 more students than E6, while E2 had 10 more students than E3.
The table is given below –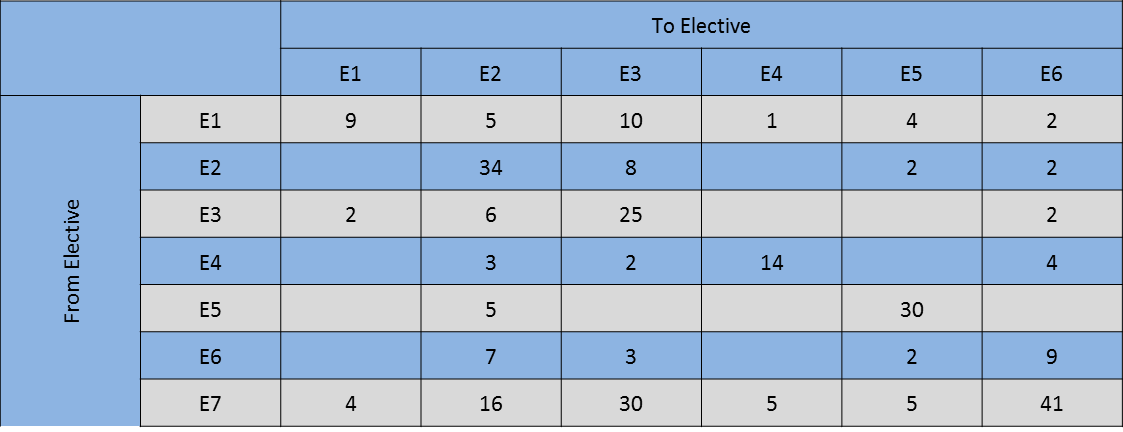
1. How many elective courses among E1 to E6 had a decrease in their enrolments after the change process?
- 4
- 1
- 2
- 3
EXPLANATION
Answer: 2 electives
This question is not as difficult as it appears at first sight. Let us give the sum of all the cells in each row and column in the final row/column.
Now, what does the last column represent? What does the overall total 292 mean? If we crack this, we are through.
The last column gives the total number of students who took each elective. Wait, is that the case? Now, the sum given right now does not include the elements that have gotten erased. That is still a missing piece of the jigsaw. We need to worry about the empty cells also. But even without worrying about these, what can we infer? What can we say about 31, 101 and 292 in the last column?
What can we say about 31, 101 and 292 in the last column?
For E1, we can say that there were 31 students who left E1 (including the 9 who stayed in E1). Since all the cells in the first row are filled. This is straight-forward. Similarly, the last row tells us that there were 101 who had originally taken E7. There are totally 300 students. So, the 292 total tells us that 8 students are yet to be accounted for. Or, of the empty cells, 8 have to be 1 and the rest have to be 0. There are totally 12 empty cells. So, 8 have to be 1’s and 4 zeroes.
Now, let us move on to other constraints. There are 1 or 2 very juicy ones here.
Before the change process there were 6 more students in E1 than in E4 – What does this tell?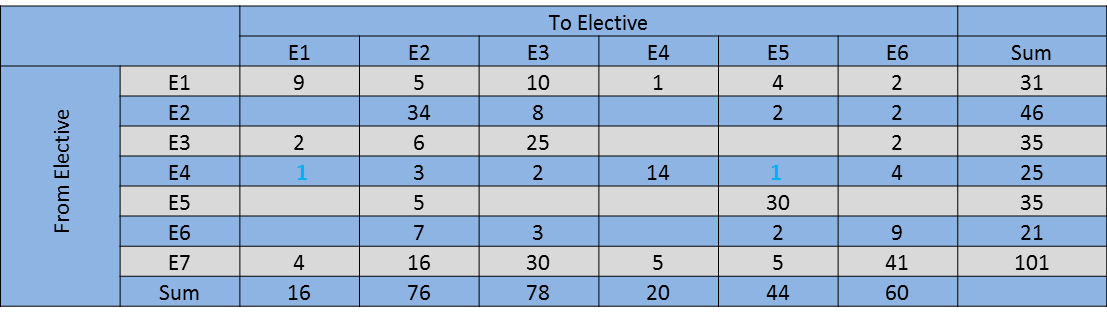
There are 31 in elective E1. So, the total number of students originally in E4 should have been 31 – 6 = 25. This is brilliant. This gives us two cells straightaway.
Before the change process, E4 had 2 more students than E6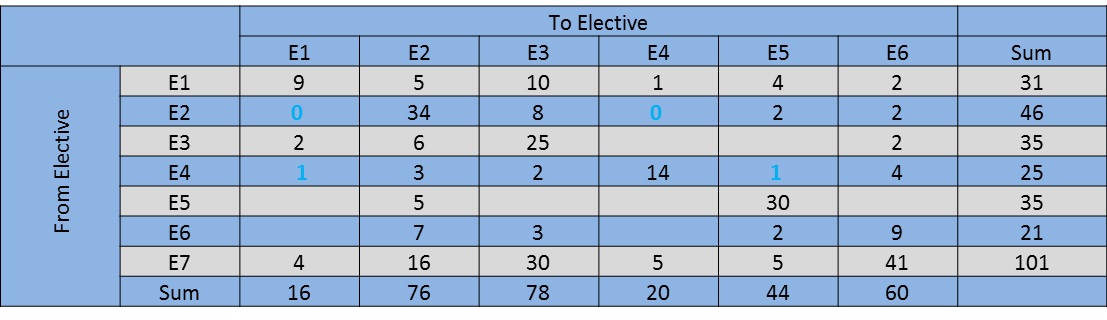
Or, two more cells get filled. The row with E6 should have empty cells now filled with 1.
Before the change process, E4 had 2 more students than E6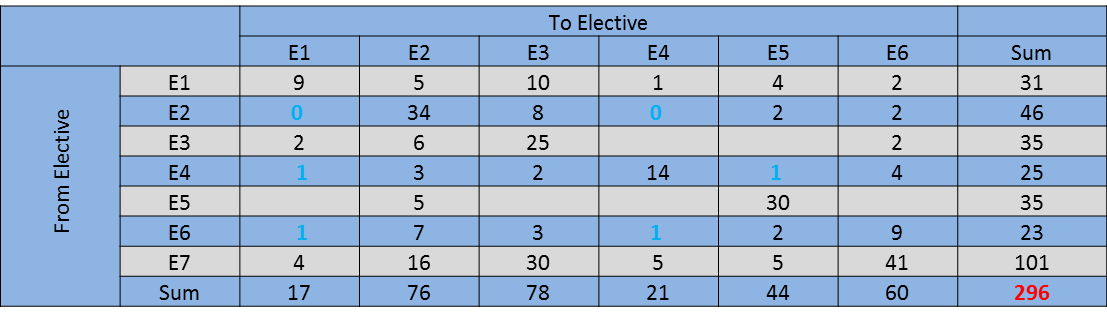
Now, let us move to the other constraints. We have filled 6 cells. We need to fill 6 more. Of the remaining 6, four have to be 1’s and 2 have to be zeroes. Only then will our total be 300.
But after the reshuffle, the number of students in E4 was 3 more than that in E1.
Currently, E4 is at 21. The maximum E1 can get to is 18 ( it is currently at 17 with one cell remaining to be filled). Or, E1 should go to 18 and E4 should remain at 21. Fabulous.
There are three cells remaining. All three should be 1 for the total to reach 300.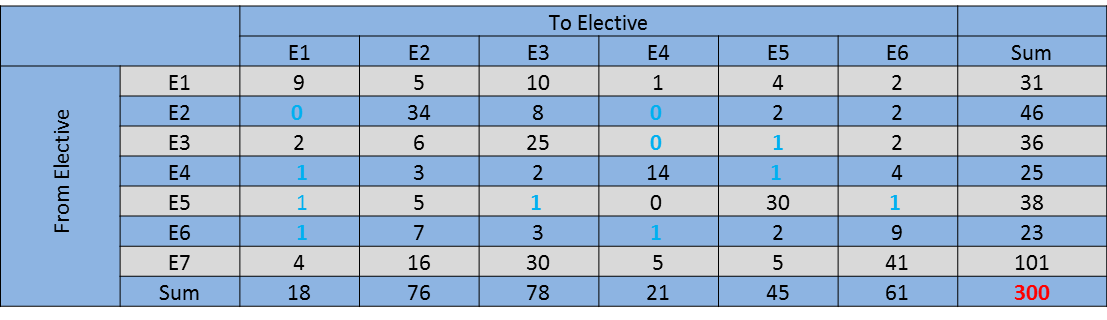
We did not even need to use the last constraint.
From the table, we can see that only E1 and E4 had a decrease in their enrolments after the change process. Totally, 2 elective courses had a decrease in their enrolments.
Hence, the answer is “2 electives “.
Choice C is the correct answer.
2. After the change process, which of the following is the correct sequence of number of students in the six electives E1 to E6?
- 19, 76, 79, 21, 45, 60
- 19, 76, 78, 22, 45, 60
- 18, 76, 79, 23, 43, 61
- 18, 76, 79, 21, 45, 61
EXPLANATION
Answer: Option D
This question is not as difficult as it appears at first sight. Let us give the sum of all the cells in each row and column in the final row/column.
Now, what does the last column represent? What does the overall total 292 mean? If we crack this, we are through.
The last column gives the total number of students who took each elective. Wait, is that the case? Now, the sum given right now does not include the elements that have gotten erased. That is still a missing piece of the jigsaw. We need to worry about the empty cells also. But even without worrying about these, what can we infer? What can we say about 31, 101 and 292 in the last column?
What can we say about 31, 101 and 292 in the last column?
For E1, we can say that there were 31 students who left E1 (including the 9 who stayed in E1). Since all the cells in the first row are filled. This is straight-forward. Similarly, the last row tells us that there were 101 who had originally taken E7. There are totally 300 students. So, the 292 total tells us that 8 students are yet to be accounted for. Or, of the empty cells, 8 have to be 1 and the rest have to be 0. There are totally 12 empty cells. So, 8 have to be 1’s and 4 zeroes.
Now, let us move on to other constraints. There are 1 or 2 very juicy ones here.
Before the change process there were 6 more students in E1 than in E4 – What does this tell?
There are 31 in elective E1. So, the total number of students originally in E4 should have been 31 – 6 = 25. This is brilliant. This gives us two cells straightaway.
Now, let us move on to other constraints. There are 1 or 2 very juicy ones here.
Before the change process there were 6 more students in E1 than in E4 – What does this tell?
There are 31 in elective E1. So, the total number of students originally in E4 should have been 31 – 6 = 25. This is brilliant. This gives us two cells straightaway.
Before the change process, E4 had 2 more students than E6
Or, two more cells get filled. The row with E6 should have empty cells now filled with 1.
Before the change process, E4 had 2 more students than E6
Now, let us move to the other constraints. We have filled 6 cells. We need to fill 6 more. Of the remaining 6, four have to be 1’s and 2 have to be zeroes. Only then will our total be 300.
But after the reshuffle, the number of students in E4 was 3 more than that in E1.
Currently, E4 is at 21. The maximum E1 can get to is 18 ( it is currently at 17 with one cell remaining to be filled). Or, E1 should go to 18 and E4 should remain at 21. Fabulous.
There are three cells remaining. All three should be 1 for the total to reach 300.
We did not even need to use the last constraint.
It is clear from the table that the sequence of number of students in the 6 electives from E1 to E6 is 18, 76, 79, 21, 45, 61.
Hence, the answer is “218, 76, 79, 21, 45, 61”
Choice D is the correct answer.
3. After the change process, which course among E1 to E6 had the largest change in its enrolment as a percentage of its original enrolment?
- E1
- E2
- E3
- E6
EXPLANATION
Answer: E6
This question is not as difficult as it appears at first sight. Let us give the sum of all the cells in each row and column in the final row/column.
Now, what does the last column represent? What does the overall total 292 mean? If we crack this, we are through.
The last column gives the total number of students who took each elective. Wait, is that the case? Now, the sum given right now does not include the elements that have gotten erased. That is still a missing piece of the jigsaw. We need to worry about the empty cells also. But even without worrying about these, what can we infer? What can we say about 31, 101 and 292 in the last column?
What can we say about 31, 101 and 292 in the last column?
For E1, we can say that there were 31 students who left E1 (including the 9 who stayed in E1). Since all the cells in the first row are filled. This is straight-forward. Similarly, the last row tells us that there were 101 who had originally taken E7. There are totally 300 students. So, the 292 total tells us that 8 students are yet to be accounted for. Or, of the empty cells, 8 have to be 1 and the rest have to be 0. There are totally 12 empty cells. So, 8 have to be 1’s and 4 zeroes.
Now, let us move on to other constraints. There are 1 or 2 very juicy ones here.
Before the change process there were 6 more students in E1 than in E4 – What does this tell?
There are 31 in elective E1. So, the total number of students originally in E4 should have been 31 – 6 = 25. This is brilliant. This gives us two cells straightaway.
Now, let us move on to other constraints. There are 1 or 2 very juicy ones here.
Before the change process there were 6 more students in E1 than in E4 – What does this tell?
There are 31 in elective E1. So, the total number of students originally in E4 should have been 31 – 6 = 25. This is brilliant. This gives us two cells straightaway.
Before the change process, E4 had 2 more students than E6
Or, two more cells get filled. The row with E6 should have empty cells now filled with 1.
Before the change process, E4 had 2 more students than E6
Now, let us move to the other constraints. We have filled 6 cells. We need to fill 6 more. Of the remaining 6, four have to be 1’s and 2 have to be zeroes. Only then will our total be 300.
But after the reshuffle, the number of students in E4 was 3 more than that in E1.
Currently, E4 is at 21. The maximum E1 can get to is 18 ( it is currently at 17 with one cell remaining to be filled). Or, E1 should go to 18 and E4 should remain at 21. Fabulous.
There are three cells remaining. All three should be 1 for the total to reach 300.
We did not even need to use the last constraint.

Therefore, E6 had the largest change in its enrolment as a percentage of its orginal enrolment.
Hence, the answer is “E6”.
Choice D is the correct answer.
4. Later, the college imposed a condition that if after the change of electives, the enrolment in any elective (other than E7) dropped to less than 20 students, all the students who had left that course will be required to re-enrol for that elective.
Which of the following is a correct sequence of electives in decreasing order of their final enrolments?
- E2, E3, E6, E5, E1, E4
- E3, E2, E6, E5, E4, E1
- E2, E5, E3, E1, E4, E6
- E2, E3, E5, E6, E1, E3
EXPLANATION
Answer: Option A
This question is not as difficult as it appears at first sight. Let us give the sum of all the cells in each row and column in the final row/column.
Now, what does the last column represent? What does the overall total 292 mean? If we crack this, we are through.
The last column gives the total number of students who took each elective. Wait, is that the case? Now, the sum given right now does not include the elements that have gotten erased. That is still a missing piece of the jigsaw. We need to worry about the empty cells also. But even without worrying about these, what can we infer? What can we say about 31, 101 and 292 in the last column?
What can we say about 31, 101 and 292 in the last column?
For E1, we can say that there were 31 students who left E1 (including the 9 who stayed in E1). Since all the cells in the first row are filled. This is straight-forward. Similarly, the last row tells us that there were 101 who had originally taken E7. There are totally 300 students. So, the 292 total tells us that 8 students are yet to be accounted for. Or, of the empty cells, 8 have to be 1 and the rest have to be 0. There are totally 12 empty cells. So, 8 have to be 1’s and 4 zeroes.
Now, let us move on to other constraints. There are 1 or 2 very juicy ones here.
Before the change process there were 6 more students in E1 than in E4 – What does this tell?
There are 31 in elective E1. So, the total number of students originally in E4 should have been 31 – 6 = 25. This is brilliant. This gives us two cells straightaway.
Now, let us move on to other constraints. There are 1 or 2 very juicy ones here.
Before the change process there were 6 more students in E1 than in E4 – What does this tell?
There are 31 in elective E1. So, the total number of students originally in E4 should have been 31 – 6 = 25. This is brilliant. This gives us two cells straightaway.
Before the change process, E4 had 2 more students than E6
Or, two more cells get filled. The row with E6 should have empty cells now filled with 1.
Before the change process, E4 had 2 more students than E6
Now, let us move to the other constraints. We have filled 6 cells. We need to fill 6 more. Of the remaining 6, four have to be 1’s and 2 have to be zeroes. Only then will our total be 300.
But after the reshuffle, the number of students in E4 was 3 more than that in E1.
Currently, E4 is at 21. The maximum E1 can get to is 18 ( it is currently at 17 with one cell remaining to be filled). Or, E1 should go to 18 and E4 should remain at 21. Fabulous.
There are three cells remaining. All three should be 1 for the total to reach 300.
We did not even need to use the last constraint.
From the table, only E1 has an enrolment less than 20. So, the 31 – 9 = 22 people who had left E1 previously will have to re-enroll to E1.
Hence, E1 will now have 22 + 18 = 40 students.
Now, because of this movement, there will be a reduction in enrollments in all the other electives also.
From the table, we can see that, E2 > E3 > E6 > E5 > E1 > E4.
Hence, the answer is “E2, E3, E6, E5, E1, E4 “.
Choice A is the correct answer.
Set 6 : Funky Pizzeria
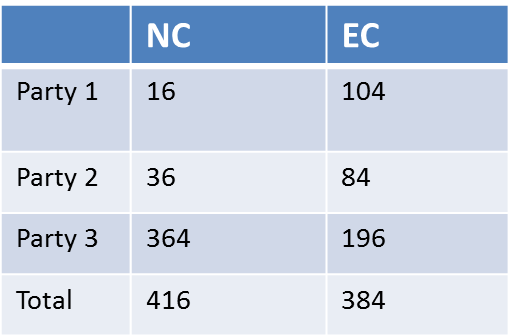
Q1-4. Funky Pizzeria was required to supply Pizzas to three different parties. The total number of Pizzas it had to deliver was 800. 70% of which was to be delivered to Party 3 and the rest equally divided between Party 1 and Party 2.
Pizzas could be of Thin Crust (T) or Deep Dish (D) variety and come in either Normal Cheese (NC) or Extra Cheese (EC) versions. Hence, there are 4 types of Pizzas: T – NC, T – EC, D-NC, D-EC. Partial information about proportions of T and NC pizzas ordered by the three parties are given below.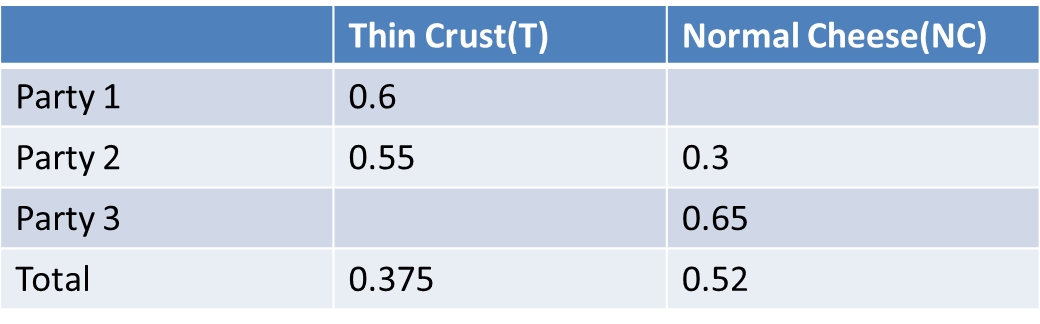
1. How many Thin Crust pizzas were to be delivered to Party 3?
- 398
- 162
- 196
- 364
EXPLANATION
Answer: 162
First, let us get some simple numbers in place. 70% of 800 people attended Party 3. Or, 560 people attended this party. The remaining 240 were split equally, or 120 each on Party 1 and Party 2.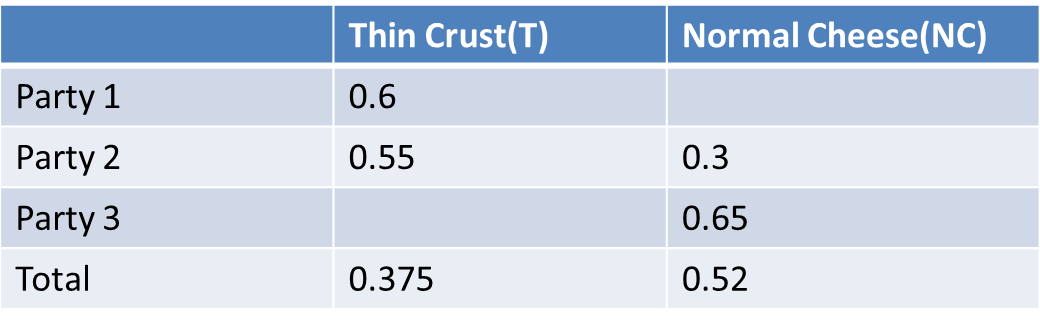
Now, let us look at these decimals. 0.6 = 3/5; 0.55 = 11/20; 0.3 = 3/10; 0.65 = 13/20;
The best of the fractions is 0.375 which is 3/8; this helps a lot. Now, we know that we are going to fill data in two classifications T or D and NC or EC. So, let us capture data also in these two formats
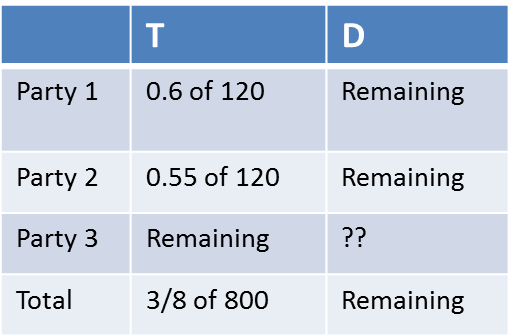
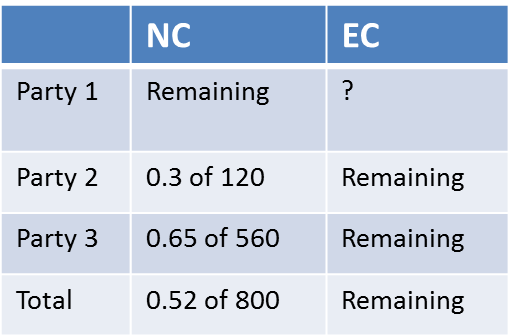
After we create these two tables, it is just a matter of filling the numbers in.
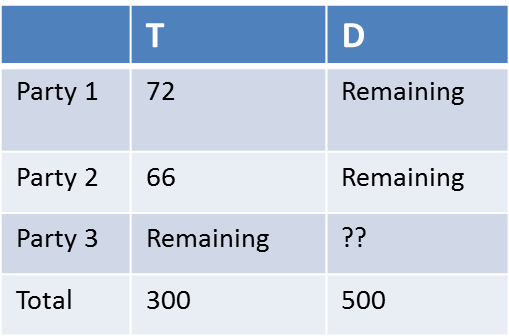
Once some numbers are present, the rest fill in automatically
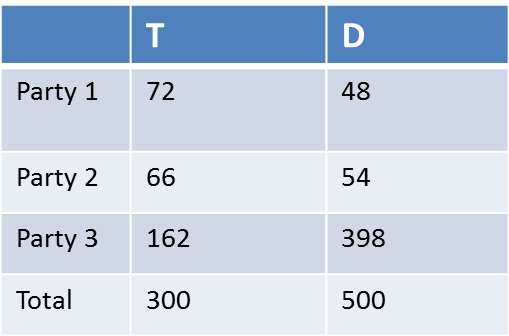
From the table, we can see that the no. of thin crust pizzas delivered to Party 3 is 162.
Hence, the answer is “162”.
Choice B is the correct answer.
2. How many Normal Cheese pizzas were required to be delivered to Party 1?
- 104
- 84
- 16
- 196
EXPLANATION
Answer: 16
First, let us get some simple numbers in place. 70% of 800 people attended Party 3. Or, 560 people attended this party. The remaining 240 were split equally, or 120 each on Party 1 and Party 2.
Now, let us look at these decimals. 0.6 = 3/5; 0.55 = 11/20; 0.3 = 3/10; 0.65 = 13/20;
The best of the fractions is 0.375 which is 3/8; this helps a lot. Now, we know that we are going to fill data in two classifications T or D and NC or EC. So, let us capture data also in these two formats
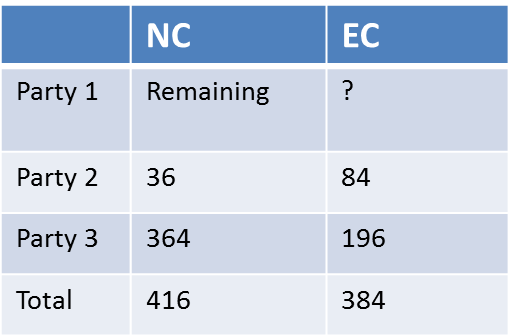
After we create these two tables, it is just a matter of filling the numbers in.
Once some numbers are present, the rest fill in automatically
From the table, we can see that the no. of Normal Cheese pizzas delivered to Party 1 is 16.
Hence, the answer is “16”.
Choice C is the correct answer.
3. For Party 2, if 50% of the Normal Cheese pizzas were of Thin Crust variety, what was the difference between the numbers of TEC and D-EC pizzas to be delivered to Party 2?
- 18
- 12
- 30
- 24
EXPLANATION
Answer: 12
First, let us get some simple numbers in place. 70% of 800 people attended Party 3. Or, 560 people attended this party. The remaining 240 were split equally, or 120 each on Party 1 and Party 2.
Now, let us look at these decimals. 0.6 = 3/5; 0.55 = 11/20; 0.3 = 3/10; 0.65 = 13/20;
The best of the fractions is 0.375 which is 3/8; this helps a lot. Now, we know that we are going to fill data in two classifications T or D and NC or EC. So, let us capture data also in these two formats
After we create these two tables, it is just a matter of filling the numbers in.
Once some numbers are present, the rest fill in automatically
We know that the no. of NC pizzas delivered to Party 2 is 36.
Hence, the answer is “12”.
Choice B is the correct answer.
4. Suppose that a T-NC pizza cost as much as a D-NC pizza, but of the price of a D-EC pizza. A D-EC pizza costs Rs. 50 more than a T-EC pizza, and the latter costs Rs. 500. If 25% of the Normal Cheese pizzas delivered to Party 1 were of Deep Dish variety, what was the total bill for Party 1?
- Rs.59480
- Rs.59840
- Rs.42520
- Rs.45240
EXPLANATION
Answer: 59480
First, let us get some simple numbers in place. 70% of 800 people attended Party 3. Or, 560 people attended this party. The remaining 240 were split equally, or 120 each on Party 1 and Party 2.
Now, let us look at these decimals. 0.6 = 3/5; 0.55 = 11/20; 0.3 = 3/10; 0.65 = 13/20;
The best of the fractions is 0.375 which is 3/8; this helps a lot. Now, we know that we are going to fill data in two classifications T or D and NC or EC. So, let us capture data also in these two formats
After we create these two tables, it is just a matter of filling the numbers in.
Once some numbers are present, the rest fill in automatically
Given, 25% of NC pizzas delivered to Party 1 were of Deep Dish variety. So, D-NC = 0.25*16 = 4. T-NC = 16 – 4 = 12. Given, D-EC = Rs. 50 more than TEC.
Given, D-EC = Rs. 50 more than TEC. Cost of TEC = Rs. 500. Hence, DEC = Rs.550.
So, cost of TNC = DNC = * 550 = 3*110 = Rs.330.
No. of TNC + DNC = 16. Cost of NC pizzas = 330*16 = 5280.
No. of T-NC = 12. Hence, T-EC = T – T-NC = 72 – 12 = 60.
Cost of T-EC pizzas = 60*500 = 30,000.
No. of D-NC = 4. Hence, D-EC = D – D-NC = 48 – 4 = 44.
Cost of D-EC pizzas = 44*550 = 24200.
Total cost = Rs. 5280 + Rs. 30000 + Rs. 24200 = Rs. 59480.
Hence, the answer is “Rs.59480”.
Choice A is the correct answer.
Set 7 : Security Scan
Q1-4. A high security research lab requires the researchers to set a pass key sequence based on the scan of the five fingers of their left hands. When an employee first joins the lab, her fingers are scanned in an order of her choice, and then when she wants to re-enter the facility, she has to scan the five fingers in the same sequence.
The lab authorities are considering some relaxations of the scan order requirements, since it is observed that some employees often get locked-out because they forget the sequence.
The lab has decided to allow a variation in the sequence of scans of the five fingers so that at most two scans (out of five) are out of place. For example, if the original sequence is Thumb (T), index finger (I), middle finger (M), ring finger (R) and little finger (L) then TLMRI is also allowed, but TMRLI is not.
1. The lab has decided to allow a variation in the sequence of scans of the five fingers so that at most two scans (out of five) are out of place. For example, if the original sequence is Thumb (T), index finger (I), middle finger (M), ring finger (R) and little finger (L) then TLMRI is also allowed, but TMRLI is not. How many different sequences of scans are allowed for any given person’s original scan? (TITA)
EXPLANATION
Answer: 11 outcomes
Let us start with the original sequence of TIMRL and then think of different variations. We can have a scenario where T & I are interchanged, then T & M being interchanged, then T & R, and so on. Or, we can have ITMRL, MITRL, RIMTL and LIMRT. Post this, we can keep T at the same slot and swap I and something else. This way, we will get TMIRL, TRMIL, TLMRI. Post this, we can move to swapping M with something else. We will get TIRML, TILRM. Finally, we can have TIMLR.
Totally we can have
ITMRL, MITRL, RIMTL and LIMRT.
TMIRL, TRMIL, TLMRI.
TIRML, TILRM.
TIMLR.
Or a total of 4 + 3 + 2 + 1 = 10 possibilities. Remember that we need to include the original as well. So, we will have a total of 11 possibilities!
Hence, the answer is “11 Possible Sequences”.
2. The lab has decided to allow variations of the original sequence so that input of the scanned sequence of five fingers is allowed to vary from the original sequence by one place for any of the fingers. Thus, for example, if TIMRL is the original sequence, then ITRML is allowed, but LIMRT is not. How many different sequences are allowed for any given person’s original scan?
- 7
- 5
- 8
- 13
EXPLANATION
Answer: 8 sequences
Let us approach this by trial and error. First up, let us say that only two finger’s positions are swapped, then we will move to the others.
If the original were TIMRL, we could have ITMRL, TMIRL, TIRML and TIMLR.
Now, let us swap 2 pairs. We can have ITRML, ITMLR and TMILR.
We cannot swap more than 2 pairs. So, we have a total of 8 possibilities – original + 4 variants where one pair is swapped + 3 variants where 2 pairs are swapped.
Hence, the answer is “8 Possible Sequences”.
Choice C is the correct answer.
3. The lab has now decided to require six scans in the pass sequence, where exactly one finger is scanned twice, and the other fingers are scanned once, which can be done in any order. For example a possible sequence is TIMTRL.
Suppose the lab allows a variation of the original sequence (of six inputs) where at most two scans are out of place, as long as the finger originally scanned twice is scanned twice and other fingers are scanned once. How many different sequences of scans are allowed for any given person’s original scan? (TITA)
EXPLANATION
Answer: 15 outcomes
This is very similar to the first one except that there are six slots. So, let us jump to the more mathematical approach. Suppose we started with TIMTRL. We need to swap some two of these six. This can be selected in 6C2 ways. OR 15 ways totally. However, sitting inside this 6C2 would be the selection of 2 T’s swapping which will not really give us a new sequence. So, we need to subtract this.
Number of new options is 6C2 -1 = 14.
Total number of possible sequences = 14 + 1 = 15.
Hence, the answer is “15 Possible Sequences”.
4. The lab has now decided to require six scans in the pass sequence, where exactly one finger is scanned twice, and the other fingers are scanned once, which can be done in any order. For example a possible sequence is TIMTRL.
Suppose the lab allows a variation of the original sequence (of six inputs) so that input in the form of scanned sequence of six fingers is allowed to vary from the original sequence by one place for any of the fingers, as long as the finger originally scanned twice is scanned twice and other fingers are scanned once. How many different sequences of scans are allowed if the original sequence is LRLTIM?
- 8
- 11
- 13
- 14
EXPLANATION
Answer: 13 sequences
We can follow an approach similar to the one we saw for the 2nd question.
Variants where only one pair is switched – RLLTIM, LLRTIM, LRTLIM, LRLITM, LRLTMI
Variants where only two pairs are switched
With the first two fingers being swapped – RLTLIM, RLLITM, RLLTMI
We can follow an approach similar to the one we saw for the 2nd question.
Variants where only one pair is switched – RLLTIM, LLRTIM, LRTLIM, LRLITM, LRLTMI
Variants where only two pairs are switched
With the first two fingers being swapped – RLTLIM, RLLITM, RLLTMI,
With the first finger is in the same position but the 2nd and 3rd are swapped – LLRITM, LLRTMI
First two positions are intact – LRTLMI
We cannot have a scenario where first three are intact.
Beyond these, we can have a scenario where 3 pairs are swapped – RLTLMI.
So, we have a total of 5 + 3 + 2 + 1 + 1 variants. Added to the original LRLTIM, this gives a total of 13 possibilities.
Hence, the answer is “13 Possible Sequences”.
Choice C is the correct answer.
Set 8 : Tea Tasting
Q1-4. A tea taster was assigned to rate teas from six different locations – Munnar, Wayanad, Ooty, Darjeeling, Assam and Himachal. These teas were placed in six cups, numbered 1 to 6, not necessarily in the same order. The tea taster was asked to rate these teas on the strength of their flavour on a scale of 1 to 10. He gave a unique integer rating to each tea.
Some other information is given below:
1. Cup 6 contained tea from Himachal.
2. Tea from Ooty got the highest rating, but it was not in Cup 3.
3. The rating of tea in Cup 3 was double the rating of the tea in Cup 5.
4. Only two cups got ratings in even numbers.
5. Cup 2 got the minimum rating and this rating was an even number.
6. Tea in Cup 3 got a higher rating than that in Cup 1.
7. The rating of tea from Wayanad was more than the rating of tea from Munnar, but less than that from Assam.
1. What was the second highest rating given? (TITA)
EXPLANATION
Answer: 7
Let us start by making some sense of the given data.
From statement 4, only two cups have been given even numbered ratings and one of them is given to the tea in Cup 2 (from statement 5).
From statement 3, it can be inferred that the rating of the tea in Cup 3, is an even number as the rating of the tea in Cup 3 is double the rating of the tea in cup 5.
If Cup 5 has a rating of x, then cup 3 has rating of 2x, which is always even.
We also know that the rating of the tea in Cup 5 is an odd number.
So cups 3 and 5 could have ratings 1 & 2, 3 & 6, or 5 & 10. Cup 2 has the least rating and so Cup 5 cannot have 1. So, cups 3 & 5 could have ratings 3 & 6, or 5 & 10. Cup 3 does not have the highest rating, so we can say Cup 5 has rating of 3 and Cup 3 has a rating of 6.
From statement 5, the rating of the tea in Cup 2 can either be 2 or 4. It cannot go above that because then, the rating of cup 5 will be 7 and rating of cup 3 will 2*7 = 14 which is not possible. But can Cup 2 really be as high as 4?
If the rating of the tea in Cup 2 is 4, the minimum possible rating for the tea in Cup 5 will be 5. Hence, the rating of the tea in Cup 3 will be 10. But cup 3 does not have the highest rating and the ratings are all unique.
Therefore, the tea in Cup 2 has a rating of 2.
Cup5 has a rating of 3 and Cup 3 has a rating of 6.
From statement (6), we can say that Cup 1 < Cup 3 . Rating of Cup 1 cannot be 1 and 3. It also cannot 4 as the number of even integer ratings is only 2. Hence, Cup 1 has a rating of 5.
So, story so far ===> Cup 1 = Rating of 5, Cup 2 = Rating of 2, Cup 3 = Rating of 6, Cup 5 = Rating of 3. The only possible remaining ratings are 7 and 9. Cups 4 and 6 should have these two ratings in some order.
Cup 6 is Himachal and Ooty has the highest rating, so Cup 6’s rating is 7 as the cup containing tea from Ooty has to be Cup 4.
Let us now create a table: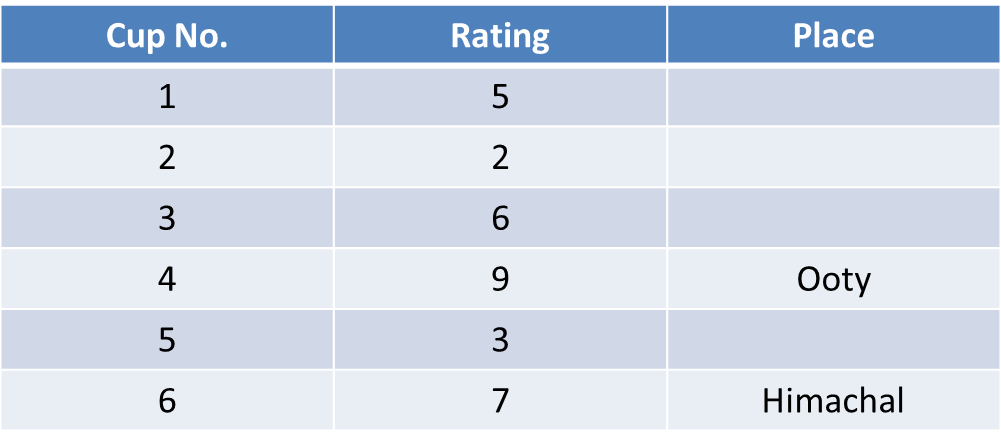
We also know that rating of Assam > Wayanad > Munnar
From the table, it is clear that the second highest rating was given to Cup 6 and the rating given was 7.
Hence, the answer is “7”.
2. What was the number of the cup that contained tea from Ooty? (TITA)
EXPLANATION
Answer: 4
Let us start by making some sense of the given data.
From statement 4, only two cups have been given even numbered ratings and one of them is given to the tea in Cup 2 (from statement 5).
From statement 3, it can be inferred that the rating of the tea in Cup 3, is an even number as the rating of the tea in Cup 3 is double the rating of the tea in cup 5.
If Cup 5 has a rating of x, then cup 3 has rating of 2x, which is always even.
We also know that the rating of the tea in Cup 5 is an odd number.
So cups 3 and 5 could have ratings 1 & 2, 3 & 6, or 5 & 10. Cup 2 has the least rating and so Cup 5 cannot have 1. So, cups 3 & 5 could have ratings 3 & 6, or 5 & 10. Cup 3 does not have the highest rating, so we can say Cup 5 has rating of 3 and Cup 3 has a rating of 6.
From statement 5, the rating of the tea in Cup 2 can either be 2 or 4. It cannot go above that because then, the rating of cup 5 will be 7 and rating of cup 3 will 2*7 = 14 which is not possible. But can Cup 2 really be as high as 4?
If the rating of the tea in Cup 2 is 4, the minimum possible rating for the tea in Cup 5 will be 5. Hence, the rating of the tea in Cup 3 will be 10. But cup 3 does not have the highest rating and the ratings are all unique.
Therefore, the tea in Cup 2 has a rating of 2.
Cup5 has a rating of 3 and Cup 3 has a rating of 6.
From statement (6), we can say that Cup 1 < Cup 3 . Rating of Cup 1 cannot be 1 and 3. It also cannot 4 as the number of even integer ratings is only 2. Hence, Cup 1 has a rating of 5.
So, story so far ===> Cup 1 = Rating of 5, Cup 2 = Rating of 2, Cup 3 = Rating of 6, Cup 5 = Rating of 3. The only possible remaining ratings are 7 and 9. Cups 4 and 6 should have these two ratings in some order.
Cup 6 is Himachal and Ooty has the highest rating, so Cup 6’s rating is 7 as the cup containing tea from Ooty has to be Cup 4.
Let us now create a table:
We also know that rating of Assam > Wayanad > Munnar
Again, from the data, we can see that the number of the cup that contained tea from Ooty is 4.
Hence, the answer is “4”.
3. If the tea from Munnar did not get the minimum rating, what was the rating of the tea from Wayanad?
- 3
- 5
- 1
- 6
EXPLANATION
Answer: 4
Let us start by making some sense of the given data.
From statement 4, only two cups have been given even numbered ratings and one of them is given to the tea in Cup 2 (from statement 5).
From statement 3, it can be inferred that the rating of the tea in Cup 3, is an even number as the rating of the tea in Cup 3 is double the rating of the tea in cup 5.
If Cup 5 has a rating of x, then cup 3 has rating of 2x, which is always even.
We also know that the rating of the tea in Cup 5 is an odd number.
So cups 3 and 5 could have ratings 1 & 2, 3 & 6, or 5 & 10. Cup 2 has the least rating and so Cup 5 cannot have 1. So, cups 3 & 5 could have ratings 3 & 6, or 5 & 10. Cup 3 does not have the highest rating, so we can say Cup 5 has rating of 3 and Cup 3 has a rating of 6.
From statement 5, the rating of the tea in Cup 2 can either be 2 or 4. It cannot go above that because then, the rating of cup 5 will be 7 and rating of cup 3 will 2*7 = 14 which is not possible. But can Cup 2 really be as high as 4?
If the rating of the tea in Cup 2 is 4, the minimum possible rating for the tea in Cup 5 will be 5. Hence, the rating of the tea in Cup 3 will be 10. But cup 3 does not have the highest rating and the ratings are all unique.
Therefore, the tea in Cup 2 has a rating of 2.
Cup5 has a rating of 3 and Cup 3 has a rating of 6.
From statement (6), we can say that Cup 1 < Cup 3 . Rating of Cup 1 cannot be 1 and 3. It also cannot 4 as the number of even integer ratings is only 2. Hence, Cup 1 has a rating of 5.
So, story so far ===> Cup 1 = Rating of 5, Cup 2 = Rating of 2, Cup 3 = Rating of 6, Cup 5 = Rating of 3. The only possible remaining ratings are 7 and 9. Cups 4 and 6 should have these two ratings in some order.
Cup 6 is Himachal and Ooty has the highest rating, so Cup 6’s rating is 7 as the cup containing tea from Ooty has to be Cup 4.
Let us now create a table:
We also know that rating of Assam > Wayanad > Munnar
Tea from Ooty is Cup 4. If the cup containg teas from Wayanad and Ooty had consecutive numbers, then the tea from Wayanad can either be in Cup 3 or Cup 5.
We also know that rating of Assam > Wayanad > Munnar .
Now, let us say tea from Wayanad is in Cup 3. Then, tea from Assam will have a lower rating then Wayanad. Therefore, Wayanad cannot be in Cup 3.
Hence, tea from Wayanad is in Cup 5. Rating of Cup 5 is 3. Also, rating of Wayanad > Munnar. Hence, tea from Munnar is in Cup 2.
That leaves us with two possibilities –
Tea from Assam is in Cup 1 with a rating of 5. Then, Cup 3 will have tea from Darjeeling and will have a rating of 6.
Tea from Assam is in Cup 3 with a rating of 6. Then, Cup 1 will have tea from Darjeeling and will have a rating of 5.
Among the answer choices, we can eliminate A, C and D.
That leaves us Choice (B).
Hence, the answer is “5”.
Choice B is the correct answer.
4. If the cup containg teas from Wayanad and Ooty had consecutive numbers, which of the following may be true ?
- Cup 5 contains tea from Assam
- Cup 1 contains tea from Darjeeling
- Tea from Wayanad has got a rating of 6
- Tea from Darjeeling got the minimum rating
EXPLANATION
Answer: Cup 1 contains tea from Darjeeling
Let us start by making some sense of the given data.
From statement 4, only two cups have been given even numbered ratings and one of them is given to the tea in Cup 2 (from statement 5).
From statement 3, it can be inferred that the rating of the tea in Cup 3, is an even number as the rating of the tea in Cup 3 is double the rating of the tea in cup 5.
If Cup 5 has a rating of x, then cup 3 has rating of 2x, which is always even.
We also know that the rating of the tea in Cup 5 is an odd number.
So cups 3 and 5 could have ratings 1 & 2, 3 & 6, or 5 & 10. Cup 2 has the least rating and so Cup 5 cannot have 1. So, cups 3 & 5 could have ratings 3 & 6, or 5 & 10. Cup 3 does not have the highest rating, so we can say Cup 5 has rating of 3 and Cup 3 has a rating of 6.
From statement 5, the rating of the tea in Cup 2 can either be 2 or 4. It cannot go above that because then, the rating of cup 5 will be 7 and rating of cup 3 will 2*7 = 14 which is not possible. But can Cup 2 really be as high as 4?
If the rating of the tea in Cup 2 is 4, the minimum possible rating for the tea in Cup 5 will be 5. Hence, the rating of the tea in Cup 3 will be 10. But cup 3 does not have the highest rating and the ratings are all unique.
Therefore, the tea in Cup 2 has a rating of 2.
Cup5 has a rating of 3 and Cup 3 has a rating of 6.
From statement (6), we can say that Cup 1 < Cup 3 . Rating of Cup 1 cannot be 1 and 3. It also cannot 4 as the number of even integer ratings is only 2. Hence, Cup 1 has a rating of 5.
So, story so far ===> Cup 1 = Rating of 5, Cup 2 = Rating of 2, Cup 3 = Rating of 6, Cup 5 = Rating of 3. The only possible remaining ratings are 7 and 9. Cups 4 and 6 should have these two ratings in some order.
Cup 6 is Himachal and Ooty has the highest rating, so Cup 6’s rating is 7 as the cup containing tea from Ooty has to be Cup 4.
Let us now create a table:
We also know that rating of Assam > Wayanad > Munnar
The cup no.’s that are still unassigned to the places are Cup1, 2, 3 and 5.
Now, among these four tea from Munnar can either be in Cup 2 or Cup 5. If the tea from munnar does not have the lowest rating, then it has a rating of 3 and hence it is in Cup 5.
We know, rating of Assam > Wayanad > Munnar . Hence, if Munnar has a rating of 3, then, Wayanad should have a rating of 5 and Assam should have rating of 6.
Hence, Wayanad has a rating of 5
Hence, the answer is ” Cup 1 contains tea from Darjeeling”.
Choice B is the correct answer.